1/27/2012 12:44:00 AM
FIN SURVEY
For a second straight year, fastener manufacturers operated at a higher percent of capacity during 2011. Inventory turnovers, finished goods on hand and raw material prices rose from the year before.
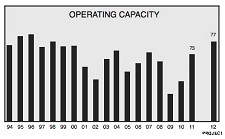
At what percent of capacity did you operate in 2011?
Manufacturer operating capacity climbed nearly 10 percentage points to a 73% average during 2011, approaching a level not seen since the late 1990s and up strongly from the 2010 capacity average of 64%. The 2009 figure of 59.3% was the lowest in the 17 years the FIN Survey has charted capacity.
The high was 79.6% for 1996.
How do finished goods on hand compare with a year ago?
• The Finished Goods Index continued its rebound in 2011, improving to 3.4 from 2010’s level of 3.2, which stopped the index’s three-year slide. The index was up from 2009’s record low of 2.2. The high was 3.5 for 2004.
How does your current raw material inventory compare with a year ago?
• After plummeting in 2009, the Raw Material Inventory continued its rebound to 3.4 in 2011, up from the 3.2 figure achieved in 2010.
Following the 2009 decline, in which a majority of FIN Survey respondents reported a “moderate decrease” in inventory, the level of inventory was increased by 60.7% of manufacturers in 2011, down slightly from 63.4% reported in 2010.
Did you have difficulty obtaining raw materials in 2011?
Raw material acquisition became more challenging, with 62% of manufacturers reporting “moderate” to “strong” difficulty in obtaining raw materials. Nearly four-in-ten manufacturers reported no raw material difficulty during the year.
Any change in price paid for steel during the past six months?
Steel prices rose during 2011, and more hikes are expected in 2012, with 62% of manufacturers forecasting “modest” to “strong” steel prices gains.
For a second straight year, fastener manufacturers operated at a higher percent of capacity during 2011. Inventory turnovers, finished goods on hand and raw material prices rose from the year before.
At what percent of capacity did you operate in 2011?
Manufacturer operating capacity climbed nearly 10 percentage points to a 73% average during 2011, approaching a level not seen since the late 1990s and up strongly from the 2010 capacity average of 64%. The 2009 figure of 59.3% was the lowest in the 17 years the FIN Survey has charted capacity.
The high was 79.6% for 1996.
How do finished goods on hand compare with a year ago?
The Finished Goods Index continued its rebound in 2011, improving to 3.4 from 2010’s level of 3.2, which stopped the index’s three-year slide. The index was up from 2009’s record low of 2.2. The high was 3.5 for 2004.
How does your current raw material inventory compare with a year ago?
After plummeting in 2009, the Raw Material Inventory continued its rebound to 3.4 in 2011, up from the 3.2 figure achieved in 2010.
Following the 2009 decline, in which a majority of FIN Survey respondents reported a “moderate decrease” in inventory, the level of inventory was increased by 60.7% of manufacturers in 2011, down slightly from 63.4% reported in 2010.
Did you have difficulty obtaining raw materials in 2011?
Raw material acquisition became more challenging, with 62% of manufacturers reporting “moderate” to “strong” difficulty in obtaining raw materials. Nearly four-in-ten manufacturers reported no raw material difficulty during the year.
Any change in price paid for steel during the past six months?
Steel prices rose during 2011, and more hikes are expected in 2012, with 62% of manufacturers forecasting “modest” to “strong” steel prices gains. ©2012 GlobalFastenerNews.com


Share: